...
Connecting to a new database
The data pool that we have created earlier will be the database we will connect to from the instance on which we are running the Superset.
Under the Sources menu, select the Databases option:
...
On the resulting page, click on the green plus sign, near the top right:
...
To configure the databaseTo get started with Apache Superset, you need to connect it to a database. Follow these steps:
Open Superset and navigate to the settings.
Click on Database Connections.
...
Choose a database to connect to; in this case, we are utilizing MySQL
...
To configure the database, enter following details:
...
Name your database
Provide the SQLAlchemy Connection URI and test the connection:
...
·
...
Connect to database by providing the necessary details such as host, port, database name, username, and password.
Click the Connect button. Once Superset can successfully connect and authenticate, you should see
...
Moreover, you should also see the list of tables Superset can read from the schema you’re connected to, at the bottom of the page:
...
If the connection looks good, save the configuration by clicking the Save button at the bottom of the page.
Adding a new table
the details in Databases like below:
...
Configuring table for Analysis
Now once a database is configured, the next step is to
...
Under the Sources menu, select the Tables option:
...
On the resulting page, click on the green plus sign, near the top left:
...
explore the data
Go to the Data menu.
Choose the connected database and select a table for analysis.
You can also go to SQL lab and explore the data to understand its structure and content.
To add the table to Superset, we need to enter certain details as follows:
The
...
target database from the Database drop-down menu
Enter the database schema
...
Click on the Save button to save the configuration
Edit the table
Click on the edit button next to the table you’ve created:
...
On the resulting page, click on the List Table Column tab. Here, you’ll define the way you can use specific columns of your table when exploring your data. We’ll run through these options to describe their purpose:
If you want users to group metrics by a specific field, mark it as Groupable.
If you need to filter on a specific field, mark it as Filterable.
Is this field something you’d like to get the distinct count of? Check the Count Distinct box.
Is this a metric you want to sum, or get basic summary statistics for? The Sum, Min, and Max columns will help.
The is temporal field should be checked for any date or time fields. We’ll cover how this manifests itself in analyses in a moment.
List of Databases Connected to Intelehealth Superset instance
The names & the corresponding SQLAlchemy Connection URI connections are as follows:
Database - AFI
Database Schema - OpenMRS_AFI
SQLAlchemy Connection URI - mysql://dbslave:dbslave_afi@13.229.131.242:3307/OpenMRS_AFI?charset=utf8
Database - VSO
Database Schema - OpenMRS_VSO
SQLAlchemy Connection URI - mysql://dbslave:dbslave_vso@13.229.131.242:3308/OpenMRS_VSO?charset=utf8
List of Tables added to AFI Database
...
Sr. No.
...
Object Type
...
Object Name
...
Added Columns
...
Comments
...
1
...
Table
...
person_attribute
...
Year
Month
...
The AFI dashboard filter box is based on these newly added columns
...
2
...
Table
...
visit_attribute
...
Year
Month
MonYear
...
3
...
Table
...
obs
...
Year
Month
MonYear
Symptoms
...
4
...
Table
...
encounter
...
Year
Month
Hour
...
5
...
Table
...
patient_identifier
...
Year
Month
...
6
...
Table
...
visit
...
Year
Month
MonYear
...
7
...
Table
...
person
...
Year
Month
...
8
...
Table
...
person_address
...
Year
Month
...
9
...
CSV Upload Table
...
AFI_Village_Data
...
This data was uploaded to create a static chart for Village wise Patient Distribution data for AFI
...
10
...
SQLlab Query
...
Doctorwisedistribution
...
Query -
SELECT obs.person_id as 'Patients',
username,
Concat("Dr.",family_name) as 'Doctor',
last_day(obs.date_created) AS Last_Date,
date_format(obs.date_created,'%Y%m') AS 'MonYear',
date_format(obs.date_created,'%Y') AS 'Year',
date_format(obs.date_created,'%m') AS 'Month'
FROM obs
inner join users on obs.creator = users.user_id
inner join person_name on users.person_id = person_name.person_id
WHERE obs.voided=0
and concept_id = '163219'
order by 3,4,5,2
...
11
...
SQLlab Query
...
PatientExperience
...
Query -
SELECT LAST_DAY(obs_datetime) AS LASTDATE,
date_format(a.obs_datetime, '%Y%m') AS MonYear,
date_format(a.obs_datetime, '%Y') AS Year,
date_format(a.obs_datetime, '%m') AS Month,
0 as Value_Text,
0 as Value_Wt,
(count(distinct person_id) -
count(distinct(case concept_id
when 163343 then person_id
else null
end))) as 'PATIENTS',
0 as 'PAT_WT',
0 as 'Weight'
FROM obs a
WHERE voided = 0
GROUP BY LAST_DAY(obs_datetime),
date_format(obs_datetime, '%Y%m'),
date_format(obs_datetime, '%Y') ,
date_format(obs_datetime, '%m')
UNION
SELECT LAST_DAY(obs_datetime) AS 'LASTDATE',
date_format(obs_datetime, '%Y%m') AS MonYear,
date_format(obs_datetime, '%Y') AS Year,
date_format(obs_datetime, '%m') AS Month,
value_text AS Value_Text,
1 as Value_Wt,
COUNT(DISTINCT person_id) AS PATIENTS,
1COUNT(DISTINCT person_id) AS 'PAT_WT',
value_textCOUNT(DISTINCT person_id) AS 'WEIGHT'
FROM obs
WHERE voided = 0
AND concept_id = 163343
GROUP BY LAST_DAY(obs_datetime),
date_format(obs_datetime, '%Y%m'),
date_format(obs_datetime, '%Y') ,
date_format(obs_datetime, '%m') ,
value_text
order by 1,2,3,4
...
12
...
SQLlab Query
...
ConsultationTimeByHW
...
Query -
SELECT
Concat(date_format(encounter.date_created,'%Y'),"/",date_format(encounter.date_created,'%m')) AS 'MonYear',
date_format(encounter.date_created,'%Y') AS 'Year',
date_format(encounter.date_created,'%m') AS 'Month',
CASE
WHEN (MINUTE(TIMEDIFF(encounter.date_created,visit.date_started)) <=10 AND MINUTE(TIMEDIFF(encounter.date_created,visit.date_started)) >= 0) THEN "0-10"
WHEN (MINUTE(TIMEDIFF(encounter.date_created,visit.date_started))>=11 AND MINUTE(TIMEDIFF(encounter.date_created,visit.date_started))<=20) THEN "11-20"
WHEN (MINUTE(TIMEDIFF(encounter.date_created,visit.date_started))>=21 AND MINUTE(TIMEDIFF(encounter.date_created,visit.date_started))<=30) THEN "21-30"
ELSE "30+"
END AS 'Time_Group'
FROM visit JOIN encounter
ON(visit.patient_id = encounter.patient_id and visit.visit_id = encounter.visit_id)
WHERE encounter.encounter_type=1
AND (visit.voided=0 and encounter.voided=0)
order by 2,3,4
...
13
...
SQLlab Query
...
PercentagePatientsSeenByDoctor
...
Query -
SELECT
if((sum(case Diagnosis
when 'TotalVisit' then Patients
else 0
end) -
sum(case Diagnosis
when 'Diagnosis Provided' then Patients
else 0
end))<0,0, (sum(case Diagnosis
when 'TotalVisit' then Patients
else 0
end) -
sum(case Diagnosis
when 'Diagnosis Provided' then Patients
else 0
end)) )as Patients,
'Diagnosis Not Provided' as 'Diagnosis',
LastDay,
MonYear,
Year,
Month
FROM(
SELECT count(distinct(patient_id)) as 'Patients',
'TotalVisit' as Diagnosis,
last_day(date_created) AS 'LastDay',
date_format(date_created,'%Y%m') AS 'MonYear',
date_format(date_created,'%Y') AS 'Year',
date_format(date_created,'%m') AS 'Month'
FROM visit
WHERE voided=0
group by last_day(date_created),
date_format(date_created,'%Y%m') ,
date_format(date_created,'%Y') ,
date_format(date_created,'%m')
UNION
SELECT count(distinct(obs.person_id)) as 'Patients',
'Diagnosis Provided' as Diagnosis,
last_day(date_created) AS 'LastDay',
date_format(obs.date_created,'%Y%m') AS 'MonYear',
date_format(obs.date_created,'%Y') AS 'Year',
date_format(obs.date_created,'%m') AS 'Month'
FROM obs
WHERE obs.voided=0
and concept_id = '163219'
group by last_day(date_created),
date_format(obs.date_created,'%Y%m') ,
date_format(obs.date_created,'%Y') ,
date_format(obs.date_created,'%m')
) as tbl
GROUP BY LastDay,
MonYear,
Year,
Month
UNION
SELECT count(distinct(obs.person_id)) as 'Patients',
'Diagnosis Provided' as Diagnosis,
last_day(date_created) AS 'LastDay',
date_format(obs.date_created,'%Y%m') AS 'MonYear',
date_format(obs.date_created,'%Y') AS 'Year',
date_format(obs.date_created,'%m') AS 'Month'
FROM obs
WHERE obs.voided=0
and concept_id = '163219'
group by last_day(date_created),
date_format(obs.date_created,'%Y%m') ,
date_format(obs.date_created,'%Y') ,
date_format(obs.date_created,'%m')
ORDER BY 3,4,5,1
...
14
...
SQLlab Query
...
DoctorAvgTAT
...
Query -
SELECT LastDay,
MonYear,
Year,
Month,
count(patient_id) as 'Total',
SUM(DiffTime) as 'TotalSec',
floor((floor(SUM(DiffTime)/count(patient_id)) mod 3600)/60)/100 as 'TotalMin',
floor(SUM(DiffTime)/count(patient_id)/3600) AS 'HRS',
((SUM(DiffTime)/count(patient_id)) mod 3600) AS 'MIN',
SEC_TO_TIME(ROUND(SUM(DiffTime)/count(patient_id))) as 'TAT'
FROM(
SELECT
last_day(date_created) as 'LastDay',
date_format(date_created,'%Y%m') as 'MonYear',
date_format(date_created,'%Y') as 'Year',
date_format(date_created,'%m') as 'Month',
patient_id,
min(date_created) as StartTime,
max(date_created) as EndTime,
timediff(max(date_created),min(date_created)) as Diff,
(hour(timediff(max(date_created),min(date_created)))*3600) +
(minute(timediff(max(date_created),min(date_created)))*60) +
(second(timediff(max(date_created),min(date_created))) )as DiffTime
FROM encounter
WHERE voided=0
AND encounter_type in (1, 9)
GROUP BY LAST_DAY(date_created),
date_format(date_created,'%Y%m'),
date_format(date_created,'%Y'),
date_format(date_created,'%m'),
patient_id
HAVING COUNT(patient_id) > 1) AS tbl
GROUP BY LastDay,
MonYear,
Year,
Month
...
15
...
SQLlab Query
...
PatientPersonal
...
Query -
select (CASE b.Gender
When 'M' then 'Male'
When 'F' then 'Female'
end) as Gender,
b.birthdate,
(b.person_id),
(a.patient_id),
a.date_created,
last_day(a.date_created) as LastDay,
date_format(a.date_created,'%Y') as Year,
date_format(a.date_created,'%m') as Month,
YEAR(curdate())-YEAR(b.birthdate) as AGE,
CASE
WHEN YEAR(curdate())-YEAR(b.birthdate) <=1 THEN "0-1"
WHEN (YEAR(curdate())-YEAR(b.birthdate)>=2 AND YEAR(curdate())-YEAR(b.birthdate)<=11) THEN "02-11"
WHEN (YEAR(curdate())-YEAR(b.birthdate)>=12 AND YEAR(curdate())-YEAR(b.birthdate)<=17) THEN "12-17"
WHEN (YEAR(curdate())-YEAR(b.birthdate)>=18 AND YEAR(curdate())-YEAR(b.birthdate)<=29) THEN "18-29"
WHEN (YEAR(curdate())-YEAR(b.birthdate)>=30 AND YEAR(curdate())-YEAR(b.birthdate)<=44) THEN "30-44"
WHEN (YEAR(curdate())-YEAR(b.birthdate)>=45 AND YEAR(curdate())-YEAR(b.birthdate)<=59) THEN "45-59"
ELSE "60+"
END AS 'AGEGRP',
c.city_village,
d.name,
e.value,
e.person_attribute_type_id
from person b,
patient_identifier a,
person_address c,
location d,
person_attribute e
where e.person_id = a.patient_id
and e.person_attribute_type_id in (11,12,13)
and d.location_id = a.location_id
and c.person_id = a.patient_id
and c.voided = 0
and c.preferred = 1
and b.person_id = a.patient_id
and b.voided = 0
and a.voided = 0
...
16
...
SQLlab Query
...
TATPerDoctor
...
Query -
SELECT LastDay,
MonYear,
Year,
Month,
DoctorId,
username,
Concat("Dr.",family_name) as 'Doctor',
count(patient_id) as 'Total',
SUM(DiffTime) as 'TotalSec',
floor((floor(SUM(DiffTime)/count(patient_id)) mod 3600)/60)/100 as 'TotalMin',
floor(SUM(DiffTime)/count(patient_id)/3600) AS 'HRS',
((SUM(DiffTime)/count(patient_id)) mod 3600) AS 'MIN',
SEC_TO_TIME(ROUND(SUM(DiffTime)/count(patient_id))) as 'TAT'
FROM(
SELECT
last_day(date_created) as 'LastDay',
date_format(date_created,'%Y%m') as 'MonYear',
date_format(date_created,'%Y') as 'Year',
date_format(date_created,'%m') as 'Month',
patient_id,
max(case encounter_type
when 9 then creator
else null end) as "DoctorId",
min(date_created) as StartTime,
max(date_created) as EndTime,
timediff(max(date_created),min(date_created)) as Diff,
(hour(timediff(max(date_created),min(date_created)))*3600) +
(minute(timediff(max(date_created),min(date_created)))*60) +
(second(timediff(max(date_created),min(date_created))) )as DiffTime
FROM encounter
WHERE voided=0
AND encounter_type in (1, 9)
GROUP BY LAST_DAY(date_created),
date_format(date_created,'%Y%m'),
date_format(date_created,'%Y'),
date_format(date_created,'%m'),
patient_id
HAVING COUNT(patient_id) > 1) AS tbl
inner join users on DoctorId = users.user_id
inner join person_name on users.person_id = person_name.person_id
GROUP BY LastDay,
MonYear,
Year,
Month,
DoctorId,
username,
Concat("Dr.",family_name)
order by 3,4;
17
...
SQLlab Query
...
...
SELECT
count(distinct t1.visit_id) as tot,
date_format(t1.date_created,"%Y") as Year,
date_format(t1.date_created,"%m") as Month,
concat(date_format(t1.date_created,"%Y") ,"/", date_format(t1.date_created,"%m")) as MonYear,
last_day(t1.date_created) as "LastDay",
'Not Provided' as Value
FROM
visit t1
LEFT JOIN
visit_attribute t2 USING (visit_id)
WHERE t2.visit_id IS NULL
and t1.voided = 0
group by date_format(t1.date_created,"%Y"),
date_format(t1.date_created,"%m"),
concat(date_format(t1.date_created,"%Y") ,"/", date_format(t1.date_created,"%m")),
last_day(t1.date_created)
union
select count(distinct visit_id) as tot,
date_format(date_created,"%Y") as Year,
date_format(date_created,"%m") as Month,
concat(date_format(date_created,"%Y") ,"/", date_format(date_created,"%m")) as MonYear,
last_day(date_created) as "LastDay",
value_reference
from visit_attribute
group by date_format(date_created,"%Y"),
date_format(date_created,"%m"),
concat(date_format(date_created,"%Y") ,"/", date_format(date_created,"%m")),
last_day(date_created) ,value_reference
order by 2,3
List of Tables added to VSO Database
...
Sr. No.
...
Object Type
...
Object Name
...
Added Columns
...
Comments
...
1
...
DB View
...
VSO_PatientVisit
...
EHRComplete
...
2
...
DB View
...
VSO_EncObs
...
BHWFormType
MidwifeFormType
...
3
...
SQLlab Query
...
VSO_Visitswithoutforms
...
Query -
select g.visit_id, sum(case g.concept_id
when 163213 then 1 else 0 end) as 'PhyEx',
sum(case g.concept_id when 163212 then 1
else 0 end) as 'CurrCom',
sum(case g.concept_id
when 163211 then 1
else 0 end) as 'FamilyHis',
sum(case g.concept_id
when 163210 then 1
else 0 end) as 'MedHis'
from VSO_EncObs g
where visit_voided = 0
and encounter_voided = 0
and obs_voided = 0
group by visit_id
...
4
...
SQLlab Query
...
VSO_Patient_Visit_Experience
...
Query -
select concat(Year,"/",Month) as YearMon,
last_day(date_started) as Date_Started,
0 as Value_Text,
0 as 'Val_WT',
0 as 'PAT_WT',
0 as 'Weight',
(count(distinct visit_id) -
count(distinct(case concept_id
when 163343 then visit_id
else null
end))) as Visits
from VSO_EncObs
where visit_voided = 0
and encounter_voided = 0
and obs_voided = 0
and location <> 'Remote'
group by Year,
Month,
last_day(date_started)
union
select concat(Year,"/",Month) as YearMon,
last_day(date_started) as Date_Started,
value_text,
1 as Value_WT,
1count(distinct(visit_id)) as 'PAT_WT',
value_textcount(distinct(visit_id)) as 'Weight',
count(distinct(visit_id)) as Visits
from VSO_EncObs
where visit_voided = 0
and encounter_voided = 0
and obs_voided = 0
and location <> 'Remote'
and concept_id = 163343
group by Year,
Month,
last_day(date_started),
value_text
order by 1,2,3,4;
Connecting to Google Sheets as Database
Superset has a feature to connect to Google Sheets as a database. There are certain setups that are necessary to be done in order to make this feature available.
Step1:
...
To implement Google authentication, create a service account as follows:
Login to Google Console Admin using your intelehealth email id (https://console.cloud.google.com/iam-admin/serviceaccounts)
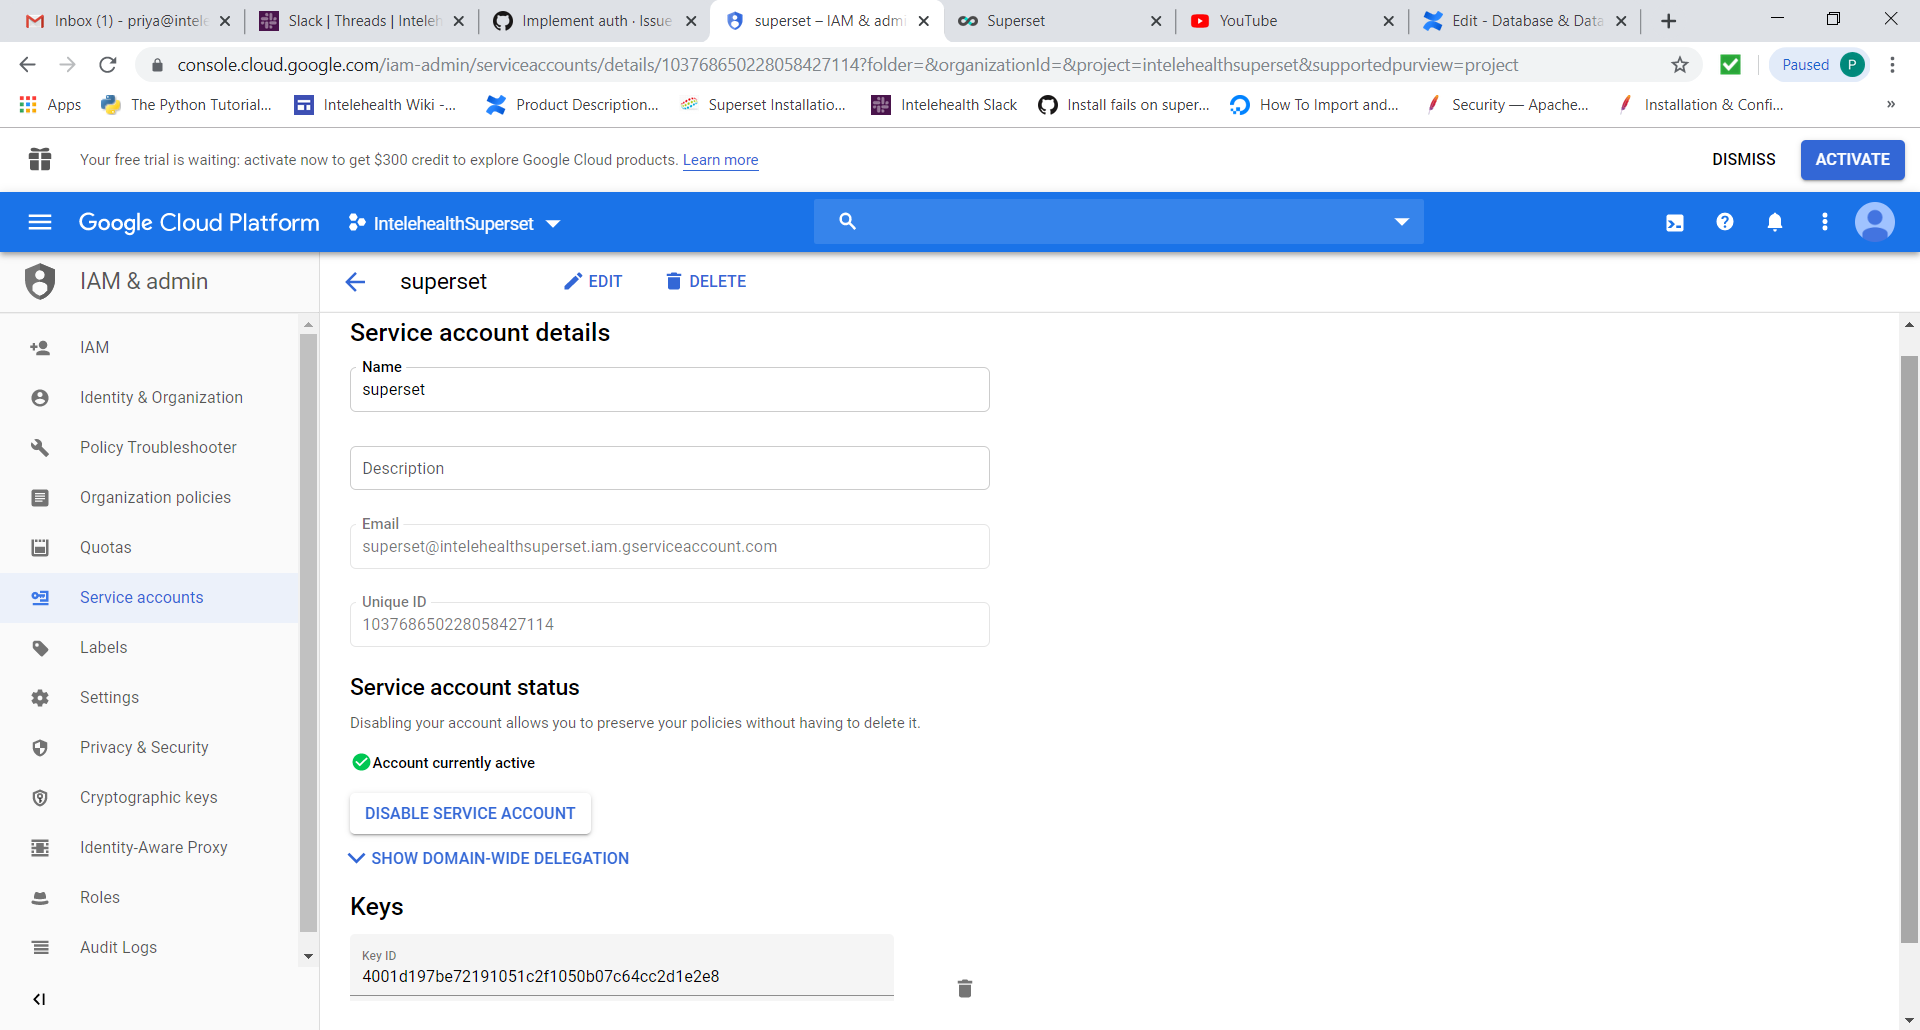
Ensure you select “Enable G-suite domain wide delegation” checkbox
Download the key created by google for your service account as json file
...
Manage API client access at https://admin.google.com/${DOMAIN}/AdminHome?chromeless=1#OGX:ManageOauthClients
Add the "Unique ID" from step 1 as the "Client Name"
Add the scope as “
https://www.googleapis.com/auth/spreadsheets.readonly”
...
Connect to superset server 13.233.116.180 (user: ubuntu)
...
Run following commands in the sequence mentioned below:
cd superset/my_viz
. bin/activate
pip install gsheetsdbpip install gsheetsdb[cli]pip install gsheetsdb[sqlalchemy]
...
Go to path /home/ubuntu/superset/my_viz/lib/python3.6/site-packages/gsheetsdb
Access file auth.py under this folder
Add the following lines at the start of function “get_credentials_from_auth”:
if not subject:
subject='priya@intelehealth.io'if not service_account_file:
service_account_file='/home/ubuntu/superset/my_viz/intelehealthsuperset-4001d197be72.json/intelehealthsuperset-4001d197be72.json'
...
stop the superset python process running on the server & restart the same
...
Connect to Superset application in browser as admin using https://dashboards.intelehealth.io
...
Go to menu Sources → Databases
...
Add a new database with below details:
Database Name: Google_Sheets
SQLAlchemy URI : gsheets://
Click the button “Test Connections”
Once the connection is established successfully, save the new database by hitting the save button
Now you can create a table based on google sheets as follows:
...
Access the menu Sources → Tables
...
The name of the table
...
Creating the Datasets
If your dataset needs specific transformations or filters, you may choose to create a dataset within Superset.
In the Datasets menu, click on +Dataset.
...
Define the dataset by selecting the database, table, and applying any filters or transformations.
...
Another method involves clicking on "Create dataset from SQL query." This action redirects you to the SQL lab, where you can write, execute SQL queries and preview the results.
...
After obtaining the desired results from the query, you can save the dataset.
...
Here are the datasets commonly used in creating dashboards:
Patient Registration:
SELECT p.patient_id,
p.date_created as PatientCreationDate,
case when pe.gender = 'M' then 'Male'
when pe.gender = 'F' then 'Female'
else 'Others' end as Gender,
pe.birthdate,
pa.location_id,
ls.name as state,
ld.name as district,
l.name as Village,
date_format(from_days(datediff(curdate(),date(pe.birthdate))), '%y')+0 as Age,
case when date_format(from_days(datediff(curdate(),date(pe.birthdate))), '%y')+0 Between 10 and 19 then '10-19'
when date_format(from_days(datediff(curdate(),date(pe.birthdate))), '%y')+0 between 20 and 39 then '20-39'
else '40+'
end as Age_group
from patient p
left join patient_identifier as pa On (pa.patient_id = p.patient_id and pa.voided = 0)
left join person as pe on (pe.person_id = p.patient_id and pe.voided = 0)
left join location l on (l.location_id = pa.location_id)
left join (select location_id,
max(case
when location_tag_id = 5 then 1 else 0
end) as is_district,
max(case
when location_tag_id = 7 then 1 else 0
end) as is_village,
max(case
when location_tag_id = 8 then 1 else 0
end) as is_state
from location_tag_map
where location_tag_id in (5,7,8)
group by location_id) lm on ( lm.location_id = l.location_id )
left join location ld on (ld.location_id = if(lm.is_district = 1,l.location_id,l.parent_location))
left join location ls on (ls.location_id = ifnull(ld.parent_location,ld.location_id))
where p.voided=0
Teleconsultation dataset:
select v.visit_id as Visits,
v.date_created as visit_created,
date_format(v.date_created, "%Y") as Year,
v.date_started as VisitStartDate,
v.date_stopped as VisitEndDate,
v.date_created as VisitCreationDate,
p.patient_id as Patients,
e.encounter_type,
(case when e.encounter_type=14 then e.encounter_datetime else null end) as visit_prescription_date,
(case when e.encounter_type=14 then 1 else 0 end) as visit_completed,
e.encounter_datetime as sign_submit_date,
.location_id,
ls.name as state,
ld.name as district,
l.name as Village
from visit v
left join patient p on (v.patient_id = p.patient_id and p.voided = 0)
left join patient_identifier pa on (p.patient_id = pa.patient_id and pa.voided = 0)
left join encounter e on (e.visit_id = v.visit_id and e.voided = 0 and e.encounter_type = 14)
left join location l on v.location_id = l.location_id
left join (select location_id,
max(case
when location_tag_id = 5 then 1 else 0
end) as is_district,
max(case
when location_tag_id = 7 then 1 else 0
end) as is_village,
max(case
when location_tag_id = 8 then 1 else 0
end) as is_state
from location_tag_map
where location_tag_id in (5,6,7,8)
group by location_id) lm on ( lm.location_id = l.location_id )
left join location ld on (ld.location_id = if(lm.is_district = 1,l.location_id,l.parent_location))
left join location ls on (ls.location_id = ifnull(ld.parent_location,ld.location_id))
where v.voided = 0
Visit Dataset:
select v.visit_id as Visits,
v.date_created as visit_created,
pe.birthdate,
date_format(from_days(datediff(curdate(),date(pe.birthdate))), '%y')+0 as Age,
case when date_format(from_days(datediff(curdate(),date(pe.birthdate))), '%y')+0 Between 10 and 19 then '10-19'
when date_format(from_days(datediff(curdate(),date(pe.birthdate))), '%y')+0 between 20 and 39 then '20-39'
else '40+' end as Age_group,
date_format(v.date_created, "%Y") as Year,
v.date_started as VisitStartDate,
v.date_stopped as VisitEndDate,
v.date_created as VisitCreationDate,
pa.location_id,
l.name as state,
ld.name as district,
l.name as Village
from visit v
left join person pe on (v.patient_id=pe.person_id and pe.voided=0)
left join patient_identifier as pa On (pa.patient_id = pe.person_id and pa.voided = 0)
left join location l on v.location_id = l.location_id
left join (select location_id,
max(case
when location_tag_id = 5 then 1 else 0
end) as is_district,
max(case
when location_tag_id = 7 then 1 else 0
end) as is_village,
max(case
when location_tag_id = 8 then 1 else 0
end) as is_state
from location_tag_map
where location_tag_id in (5,6,8)
group by location_id) lm on ( lm.location_id = l.location_id )
left join location ld on (ld.location_id = if(lm.is_district = 1,l.location_id,l.parent_location))
left join location ls on (ls.location_id = ifnull(ld.parent_location,ld.location_id))
where v.voided = 0
Health Worker Score card:
select t.visit_id,
t.date_started,
t.date_stopped,
t.Village,
t.district,
t.state,
t.visit_type_id,
u.username as "Health Worker"
from encounter e,
users u,
(select v.visit_id,
v.date_created,
v.date_started,
v.visit_type_id,
v.date_stopped,
v.location_id,
v.creator,
l.name as Village,
ld.name as district,
ifnull(ls.name,ld.name) as state,
max(e.encounter_id) max_enc
from visit v,
encounter e,
location l,
visit_type vt,
(select location_id,
max(case
when location_tag_id = 5 then 1 else 0
end) as is_district,
max(case
when location_tag_id = 7 then 1 else 0
end) as is_village,
max(case
when location_tag_id = 8 then 1 else 0
end) as is_state
from location_tag_map
where location_tag_id in (5,6,7,8)
group by location_id) lm,
location ld,
location ls
where v.voided = 0
and e.voided = 0
and e.visit_id = v.visit_id
and l.location_id = v.location_id
and lm.location_id = l.location_id
and ld.location_id = if(lm.is_district = 1,l.location_id,l.parent_location)
and ls.location_id = ifnull(ld.parent_location,ld.location_id)
group by v.visit_id,
v.date_created,
v.date_started,
v.visit_type_id,
v.date_stopped,
v.visit_type_id,
v.creator,
v.location_id,
) as t
where t.max_enc = e.encounter_id
and e.voided = 0
and u.user_id = t.creator
Doctor Score Card:
select v.visit_id as visits,
v.date_created as VisitCreationDate,
v.date_stopped as VisitEndDate,
v.date_started as VisitStartDate,
v.patient_id,
v.location_id,
l.name as Village,
ld.name as district,
ls.name as state,
ep.creator,
ifnull(u.username,"Admin") as Doctor,
-- concat(pn.given_name," ",pn.family_name) as name,
max(va.value_reference) as visit_refer,
max(case when e.encounter_type = 14 then e.encounter_datetime else NULL end) as visit_complete_time,
max(case when e.encounter_type = 14 then 1 else 0 end) as visit_completed,
max(case when e.encounter_type = 9 then 1 else 0 end) as visit_cosulted,
max(case when o.concept_id = 163219 then 1 else 0 end) as Diagnosis,
max(case when o.concept_id = 163205 then 1 else 0 end) as Medical_advice,
max(case when o.concept_id = 163206 then 1 else 0 end) as Medical_test,
max(case when o.concept_id = 163345 then 1 else 0 end) as followup,
max(case when o.concept_id = 163202 then 1 else 0 end) as Prescription
from visit v
left join location l on (l.location_id = v.location_id)
left join visit_attribute va on (va.visit_id = v.visit_id and va.voided = 0 and va.attribute_type_id = 8)
left join (select location_id,
max(case
when location_tag_id = 5 then 1 else 0
end) as is_district,
max(case
when location_tag_id = 7 then 1 else 0
end) as is_village,
max(case
when location_tag_id = 8 then 1 else 0
end) as is_state
from location_tag_map
where location_tag_id in (5,6,7,8)
group by location_id) lm on ( lm.location_id = l.location_id )
left join location ld on (ld.location_id = if(lm.is_district = 1,l.location_id,l.parent_location))
left join location ls on (ls.location_id = ifnull(ld.parent_location,ld.location_id))
left join encounter e on (e.visit_id = v.visit_id and e.voided = 0 )
left join encounter_provider ep on (ep.encounter_id = e.encounter_id and ep.voided = 0)
left join obs o on (o.encounter_id = e.encounter_id and o.voided = 0 and o.comments is null and o.creator = ep.creator and o.concept_id in (163219, 163202,163205,163206,163345))
left join users u on (u.user_id = ep.creator)
-- left join person_name pn on (pn.person_id = u.person_id and pn.voided = 0 and pn.preferred =1)
where v.voided = 0
and e.encounter_type in (9,14)
-- and v.visit_id in (13,14)
group by v.visit_id,
v.date_created,
v.date_stopped,
v.date_started,
v.patient_id,
v.location_id,
l.name ,
l.state_province,
ep.creator,
u.username
Patient TAT:
SELECT date_format(v.date_created, "%Y-%m") as MonYear,
ls.name as state,
ld.name as district,
l.name as Village,
v.date_created as VisitCreationDate,
last_day(v.date_created) as Last_Day,
v.date_started as visit_start_date,
v.date_stopped as visit_end_date,
p.patient_id as patients,
v.visit_id as visits,
p.date_created as patient_creation_date,
max(case when va.attribute_type_id = 5 then va.value_reference else null end) as visit_specialty
from visit v
left join patient p on (v.patient_id = p.patient_id and p.voided = 0)
left join visit_attribute va on (va.visit_id = v.visit_id and va.voided = 0 and va.attribute_type_id =5)
left join location l on v.location_id = l.location_id
left join (select location_id,
max(case
when location_tag_id = 5 then 1 else 0
end) as is_district,
max(case
when location_tag_id = 7 then 1 else 0
end) as is_village,
max(case
when location_tag_id = 8 then 1 else 0
end) as is_state
from location_tag_map
where location_tag_id in (5,6,8)
group by location_id) lm on ( lm.location_id = l.location_id )
left join location ld on (ld.location_id = if(lm.is_district = 1,l.location_id,l.parent_location))
left join location ls on (ls.location_id = ifnull(ld.parent_location,ld.location_id))
and v.voided = 0
group by 1,2,3,4,5,6,7,8,9,10,11
Doctor TAT:
SELECT v.visit_id,
v.date_started,
v.date_created,
v.date_stopped,
v.location_id,
ls.name as state,
ld.name as district,
l.name as Village,
e.encounter_datetime,
e.creator ,
concat('Dr.',' ',u.username) as Doctor
from visit v
left join encounter e on (v.visit_id = e.visit_id and e.voided = 0 )
left join users u on (u.user_id = e.creator)
left join location l on (v.location_id = l.location_id )
left join (select location_id,
max(case
when location_tag_id = 5 then 1 else 0
end) as is_district,
max(case
when location_tag_id = 7 then 1 else 0
end) as is_village,
max(case
when location_tag_id = 8 then 1 else 0
end) as is_state
from location_tag_map
where location_tag_id in (5,6,7,8)
group by location_id) lm on ( lm.location_id = l.location_id )
left join location ld on (ld.location_id = if(lm.is_district = 1,l.location_id,l.parent_location))
left join location ls on (ls.location_id = ifnull(ld.parent_location,ld.location_id))
where v.voided = 0
and e.encounter_type = 14
Patient Experience:
select v.visit_id as Visit,
v.date_created as VisitCreationDate,
date_format(v.date_stopped, '%Y-%m') as MonYear,
date_format(v.date_stopped, '%m') as Month,
v.date_stopped as VisitEndDate,
v.date_started as VisitStartDate,
v.patient_id,
v.location_id,
l.name as Village,
ls.name as state,
ld.name as district,
o.concept_id,
o.value_numeric,
case when o.value_text is Null then 'Unknown' else o.value_text end as value_text
from visit v
left join location l on (l.location_id = v.location_id)
left join (select location_id,
max(case
when location_tag_id = 5 then 1 else 0
end) as is_district,
max(case
when location_tag_id = 7 then 1 else 0
end) as is_village,
max(case
when location_tag_id = 8 then 1 else 0
end) as is_state
from location_tag_map
where location_tag_id in (5,6,7,8)
group by location_id) lm on ( lm.location_id = l.location_id )
left join location ld on (ld.location_id = if(lm.is_district = 1,l.location_id,l.parent_location))
left join location ls on (ls.location_id = ifnull(ld.parent_location,ld.location_id))
left join encounter e on (e.visit_id = v.visit_id and e.voided = 0 and encounter_type = 12 )
left join obs o on (o.encounter_id = e.encounter_id and o.voided = 0 and o.concept_id = 163343)
where v.voided = 0
Health Workers created vs Active:
select u.user_id,
u.username,
concat(pn.given_name," ",pn.family_name) as name,
u.date_created as time_date,
case when ur.role = 'Organizational: Doctor' then "Doctor"
else "HW"
end as role,
"Creation" as process
From users u
inner join user_role ur on (ur.user_id = u.user_id and ur.role = "Organizational: Nurse")
left join person_name pn on (pn.person_id = u.person_id andpn.voided = 0 and pn.preferred = 0)
where retired = 0
union
select u.user_id,
u.username,
concat(pn.given_name," ",pn.family_name) as name,
v.date_started as time_date,
"HW active" as role,
"HW active" as process
From visit v
inner join users u on (u.user_id = v.creator)
left join person_name pn on (pn.person_id = u.person_id and pn.voided = 0 and pn.preferred = 1)
where v.voided = 0
union
select null as user_id,
null as username,
null as name,
date_created as time_date,
'Dummy' as role,
'Creation' as process
From patient
Where voided = 0
Doctor Created vs Active:
select u.user_id,
u.username,
concat(pn.given_name," ",pn.family_name) as name,
u.date_created as time_date,
case
when ur.role = 'Organizational: Doctor' then "Doctor"
else "HW"
end as role,
"Creation" as process
From users u
inner join user_role ur on (ur.user_id = u.user_id and ur.role = "Organizational: Doctor")
left join person_name pn on (pn.person_id = u.person_id and pn.voided = 0 and pn.preferred = 0)
where retired = 0
union
select u.user_id,
u.username,
concat(pn.given_name," ",pn.family_name) as name,
v.encounter_datetime as time_date,
"Doctor" as role,
"Doctor active" as process
From encounter v
inner join users u on (u.user_id = v.creator)
left join person_name pn on (pn.person_id = u.person_id and pn.voided = 0 and pn.preferred = 1)
where v.voided = 0
and v.encounter_type = 14
union
select null as user_id,
null as username,
null as name,
date_created as time_date,
'Dummy' as role,
'Creation' as process
From patient
Where voided = 0
Diagnosis Dataset:
select v.visit_id as Visits,
v.date_created as VisitCreationDate,
date_format(v.date_stopped, '%Y-%m') as MonYear,
date_format(v.date_stopped, '%m') as Month,
v.date_stopped as VisitEndDate,
v.date_started as VisitStartDate,
v.patient_id,
v.location_id,
ls.name as state,
ld.name as district,
l.name as Village,
o.concept_id,
o.value_numeric,
o.value_text
from visit v
join encounter e on (e.visit_id = v.visit_id and e.voided = 0 and e.encounter_type in (1,9,12,14))
join obs o on (o.encounter_id = e.encounter_id and o.voided = 0 and o.concept_id =163219)
left join location l on v.location_id = l.location_id
left join (select location_id,
max(case
when location_tag_id = 5 then 1 else 0
end) as is_district,
max(case
when location_tag_id = 7 then 1 else 0
end) as is_village,
max(case
when location_tag_id = 8 then 1 else 0
end) as is_state
from location_tag_map
where location_tag_id in (5,6,8)
group by location_id) lm on ( lm.location_id = l.location_id )
left join location ld on (ld.location_id = if(lm.is_district = 1,l.location_id,l.parent_location))
left join location ls on (ls.location_id = ifnull(ld.parent_location,ld.location_id))
where v.voided = 0
Creating the Charts/Visualization
In Apache Superset, there are several methods available for creating charts.
Head to the Charts menu in Superset.
Choose the dataset or table you want to visualize.
Select the appropriate chart type (bar chart, line chart, etc.).
· Define metrics and dimensions for the visualization.
o Metrics: It defines the numerical measures, such as sales or revenue, plotted on the chart.
o Dimensions: It categorizes data, like time or location, providing context and grouping for analysis.
o Filters: It refines chart data by allowing the selection of specific criteria, focusing on relevant subsets.
o Breakdown: It adds additional layers of analysis by splitting metrics based on a chosen dimension.
o Sort By: It organizes data presentation by arranging either metrics or dimensions in ascending or descending order.
· Customize the chart settings as needed.
· Another method for creating a chart is available after running an SQL query in the SQL lab. There, you will find an option to generate a chart specifically for the queried data.
· While working with charts in Apache Superset, you have access to a range of functions and settings that enable customization and enhancement of visualizations. Here is an overview of some common functions within the chart settings:
o Title: A descriptive title that summarizes the main purpose or message of the chart.
o Legend: A key that explains the colors or symbols used in the chart and associates them with different data series or categories.
o Axes: The X-axis and Y-axis represent the horizontal and vertical scales, respectively. They provide the framework for plotting data points.
o Data Series: The actual plotted data points that visually represent the information being conveyed. Different types of charts may have one or more data series.
o Labels: Labels on the axes and data points provide context and help users understand the values or categories represented.
o Gridlines: Horizontal and vertical lines on the chart background assist in reading values and understanding the scale.
o Markers/Points: Specific symbols or points on the chart that represent individual data points, especially in scatter plots or line charts.
o Tooltip: An interactive feature that displays additional information when the user hovers over or clicks on a data point. It often shows exact values or details.
o Annotations: Additional text or shapes added to the chart to provide context or highlight specific points of interest.
o Data Labels: Numeric values displayed directly on or near the data points, making it easy to read the exact values.
o Background: The overall visual background of the chart, which may include colors or shading to enhance readability.
o Axis Titles: Descriptive labels for the X-axis and Y-axis, indicating what each axis represents.
o Color Scheme: The chosen colors for data series or categories, which can affect the visual impact and interpretation of the chart.
o Axis Scales: The measurement units and intervals on the axes, determining the scale and granularity of the chart.
o Baseline: A reference line indicating a specific point on the chart, often used for comparison or analysis.
· Within the charts section of Apache Superset, advanced analytics features include rolling window/rolling functions, enabling enhanced data exploration through functions like mean, sum, standard deviation, and cumulative sum.
These components collectively contribute to the overall visual representation of data in a chart, aiding in conveying insights effectively. The specific components may vary depending on the type of chart and the charting tool being used.
Adding Visualizations to a Dashboard:
Compile the individual visualizations into a well-organized dashboard, ensuring a seamless and user-friendly experience from data exploration to presentation.
Create a New Dashboard: If you don't have an existing dashboard, create a new one. Look for a "+dashboard" button or an option to "Create New Dashboard" directly within the dashboard interface.
Add Layout Elements: Look for options to add layout elements such as rows, columns, headers, text boxes, dividers, and tabs directly within the dashboard.
o Rows and Columns: Adjust the layout by adding rows and columns to organize visualizations and other elements.
o Headers: Include headers to provide context or titles for specific sections of the dashboard.
o Text Boxes: Add text boxes to insert explanatory notes or additional information.
o Dividers: Use dividers to visually separate different sections of the dashboard.
o Tabs: Create tabs to organize content and allow users to switch between different views or sets of visualizations.
Add Charts/Visualizations:
o Choose a Visualization: Select the chart or visualization you want to add to the dashboard. This could be a chart you've previously created in the charting or SQL lab section.
o Open the Visualization: Once you've selected a visualization, open it to view the details and customize settings if needed.
o Arrange Visualizations: Arrange the added visualizations within the dashboard. Most tools allow you to drag and drop visualizations to different positions. Decide on the position of the visualization within the dashboard layout.
o Configure Size and Appearance: Adjust the size and appearance settings of the visualization to fit the dashboard layout and design preferences.
o Customize Dashboard Layout: Adjust the overall layout of the dashboard, including grid arrangements, sizing, and spacing.
o Save the Dashboard: Save your dashboard to retain the arrangement and configurations.
Add Filters to the Dashboard
o Access Filters: Within the dashboard editing interface, look for an option to add filters. This is often in the form of a "Filter" or "Add Filter" button.
o Define Filter Criteria: Choose the dimension or metric you want to filter by. Define the criteria for the filter, such as specific values or ranges.
o Apply the Filter to Visualizations: After defining the filter, associate it with the relevant visualizations. You may need to specify which visualizations should be affected by the filter.
o Customize Filter Type: Depending on the type of filter (e.g., dropdown, date range), customize its appearance and behavior. Some filters may allow users to select multiple values or apply date range restrictions.
o Note: While adding a filter to the dashboard, ensure that the corresponding column is present in the dataset. Filters are applied based on specific dataset columns; therefore, having the relevant column in the dataset is essential for the filter to function effectively in conjunction with the charts and visualizations.
o In the following snippet, we've implemented filters for 'Time' and 'Village.' To ensure the proper functioning of these filters, it is essential to have Time and Village columns in our dataset.
o Save the Dashboard: Save your changes to the dashboard to preserve the added filters.
List Users:
· Open Settings and Navigate to Security
· Within the Security settings, find and click on the "List Users" option
· On the "List Users" page, view and manage user details. Fill in any necessary information related to user accounts, roles, and permissions. Ensure that the "is active" status is appropriately marked for users in the list.
· This process allows administrators to easily access and manage user accounts in Apache Superset.
List Roles:
· Open Settings and Navigate to Security
· Within the Security settings, find and click on the "List Roles" option
· Below are the default List of Roles in Apache Superset.
Admin: Admins have full access to all functionalities within Superset. They can manage users, roles, databases, and all aspects of the application.
Public: This role represents public access. Users with the public role typically have limited access to view and explore data without the ability to modify or create new content.
Alpha: This role typically represents users who are early adopters or testers. They may have access to features that are in the alpha stage of development.
Gamma: Similar to the Alpha role, Gamma users may have access to features in the gamma stage of development, indicating features that are more stable than alpha but still in testing.
Granter: Granters have the ability to grant access to specific datasets or dashboards to other users. They play a role in managing access permissions.
SQL Lab: Users with this role have access to the SQL Lab functionality, allowing them to write and execute SQL queries.
· It's important to note that the specific roles and their permissions can be customized based on the Superset instance's configuration and the organization's requirements.
o As per our preferences, we've established two specific roles: "Reset Password" to manage password resets, and "read_role" granting users read access to all datasets incorporated into dashboards, ensuring comprehensive access for data exploration.
· As per the user's request, we are tasked with creating roles to restrict user access to menus on the dashboard level chart. Below are the selected permissions aimed at achieving this requirement:
· In accordance with our standard practice, users are typically assigned three roles: "Reset Password" ,"Read_role" with read access to all dashboard datasets, and "Gamma."
List of Charts:
No | Chart Name | Visulaization type | Dataset Used | Metric | Dimension | Filter | Time | Number Format | X label | Y axis label | Chart Options | Rolling Function |
1 | Total patients registered | Big Number | Patient Dataset | Patient_id |
|
| PatientCreationDate | Original value |
|
|
|
|
2 | Patient registration trend | Line Chart | Patient Dataset | Patient_id |
|
| PatientCreationDate |
| Registration Date | Number of Patients registered |
|
|
3 | Total patients registered age-wise | Bar Chart | Patient Dataset | Patient_id | Age_group |
| PatientCreationDate |
| Age Group | Number of Patients | Bar value, stacked bars |
|
4 | Total Consultations Scheduled | Big number | Teleconsultation Dataset | Visit_id |
|
| VisitCreatedDate | Original value |
|
|
|
|
5 | Total Consultations Completed | Big number | Teleconsultation Dataset | Visit_id |
| Encounter_type=14 | SignSubmitDate | Original value |
|
|
|
|
6 | Request Completion Ratio | Bar chart with trend line (Mixed Time seried | Teleconsultation Dataset |
|
|
| VisitCreatedDate |
| Months of the Year | Number of Teleconsultations |
|
|
7 | Total Visits-Geographies | Table | Teleconsultation Dataset | Visit_id | State, District, Village |
| VisitCreatedDate |
|
|
|
|
|
8 | Total Visits | Bar Chart | Visit Dataset | Visit_id | Age_group |
| VisitCreatedDate |
| Age Group | Number of Visits |
|
|
9 | Health workers score card | Table | Health workers score card | Health Worker | 1.Teleconsultation Started |
| Date_started |
|
|
|
|
|
10 | Doctors score card | Table | Doctors score card | Doctor |
|
| Date_started |
|
|
|
|
|
11 | Patient TAT | Line Chart | Patient TAT | TAT |
| VisitEndDate is not null | VisitEndDate |
|
|
|
|
|
12 | Doctor TAT | Line Chart | Doctor TAT | TAT |
|
| Encounter_datetime |
|
|
| Rich tooltip |
|
13 | Average Patient Experience | Line Chart | Patient Experience | sum(value_text)/count(Visit) | MonYear |
|
|
| Months | Average Satisfaction Score | Rich tooltip, show values |
|
14 | Average Doctor Response Time | Line Chart | Doctor TAT | TAT (Formula) | Doctor |
| Encounter_datetime |
|
|
|
|
|
15 | Hour Wise Distribution | Bar Chart | Visit Dataset | Visit_id | rpad(lpad(hour(VisitStartDate),2,0),5,':00') |
| VisitStartDate |
| Hour of the day | Number of Visits | Rich tooltip, Bar values, sort bars |
|
16 | Health workers created versus active | Bar Chart | Health workers created versus active | User_id |
| For HW_created -process=creation | Date_creted(users) |
| Months | Count | show values, Marker | Cumsum |
17 | Doctors created versus active | Bar Chart | Doctors created vs active | User_id |
| For Doctor_created- Process=Creation | Date_creted(users) |
| Months | Count | show values, Marker | Cumsum |
18 | Diagnosis by Doctors | Bar Chart | Diagnosis by Doctors | Visit_id | value_text |
| VisitCreatedDate |
| Diagnosis | Number of Teleconsultations |
|
|