To create slices (charts) and dashboards in Superset, we need to connect Superset to a database and configure a table in that database for analysis. We can then explore the data that we have exposed and add a visualization to a dashboard so that we get a feel for the end-to-end user experience.
Connecting to a new database
The data pool that we have created earlier will be the database we will connect to from the instance on which we are running the Superset.
Under the Sources menu, select the Databases option:

On the resulting page, click on the green plus sign, near the top right:

To configure the database, enter following details:
Name your database
Provide the SQLAlchemy Connection URI and test the connection:

Click the Test Connection button to confirm things work end to end. Once Superset can successfully connect and authenticate, you should see a popup like this:

Moreover, you should also see the list of tables Superset can read from the schema you’re connected to, at the bottom of the page:

If the connection looks good, save the configuration by clicking the Save button at the bottom of the page.
Adding a new table
Now once a database is configured, the next step is to add specific tables to Superset that we would like to query.
Under the Sources menu, select the Tables option:

On the resulting page, click on the green plus sign, near the top left:
To add the table to Superset, we need to enter certain details as follows:
The name of the table
The target database from the Database drop-down menu
Enter the database schema (optional).
Click on the Save button to save the configuration
Edit the table
Click on the edit button next to the table you’ve created:

On the resulting page, click on the List Table Column tab. Here, you’ll define the way you can use specific columns of your table when exploring your data. We’ll run through these options to describe their purpose:
If you want users to group metrics by a specific field, mark it as Groupable.
If you need to filter on a specific field, mark it as Filterable.
Is this field something you’d like to get the distinct count of? Check the Count Distinct box.
Is this a metric you want to sum, or get basic summary statistics for? The Sum, Min, and Max columns will help.
The is temporal field should be checked for any date or time fields. We’ll cover how this manifests itself in analyses in a moment.
List of Databases Connected to Intelehealth Superset instance
The names & the corresponding SQLAlchemy Connection URI connections are as follows:
Database - AFI
Database Schema - OpenMRS_AFI
SQLAlchemy Connection URI - mysql://dbslave:dbslave_afi@13.229.131.242:3307/OpenMRS_AFI?charset=utf8
Database - VSO
Database Schema - OpenMRS_VSO
SQLAlchemy Connection URI - mysql://dbslave:dbslave_vso@13.229.131.242:3308/OpenMRS_VSO?charset=utf8
List of Tables added to AFI Database
Sr. No. | Object Type | Object Name | Added Columns | Comments |
1 | Table | person_attribute | Year | The AFI dashboard filter box is based on these newly added columns |
2 | Table | visit_attribute | Year | |
3 | Table | obs | Year | |
4 | Table | encounter | Year | |
5 | Table | patient_identifier | Year | |
6 | Table | visit | Year | |
7 | Table | person | Year | |
8 | Table | person_address | Year | |
9 | CSV Upload Table | AFI_Village_Data | This data was uploaded to create a static chart for Village wise Patient Distribution data for AFI | |
10 | SQLlab Query | Doctorwisedistribution | Query - | |
11 | SQLlab Query | PatientExperience | Query - | |
12 | SQLlab Query | ConsultationTimeByHW | Query - | |
13 | SQLlab Query | PercentagePatientsSeenByDoctor | Query - | |
14 | SQLlab Query | DoctorAvgTAT | Query - | |
15 | SQLlab Query | PatientPersonal | Query - | |
16 | SQLlab Query | TATPerDoctor | Query - | |
17 | SQLlab Query | SELECT |
List of Tables added to VSO Database
Sr. No. | Object Type | Object Name | Added Columns | Comments |
1 | DB View | VSO_PatientVisit | EHRComplete | |
2 | DB View | VSO_EncObs | BHWFormType MidwifeFormType | |
3 | SQLlab Query | VSO_Visitswithoutforms | Query - select g.visit_id, sum(case g.concept_id | |
4 | SQLlab Query | VSO_Patient_Visit_Experience | Query - select concat(Year,"/",Month) as YearMon, |
Connecting to Google Sheets as Database
Superset has a feature to connect to Google Sheets as a database. There are certain setups that are necessary to be done in order to make this feature available.
Step1:
To implement Google authentication, create a service account as follows:
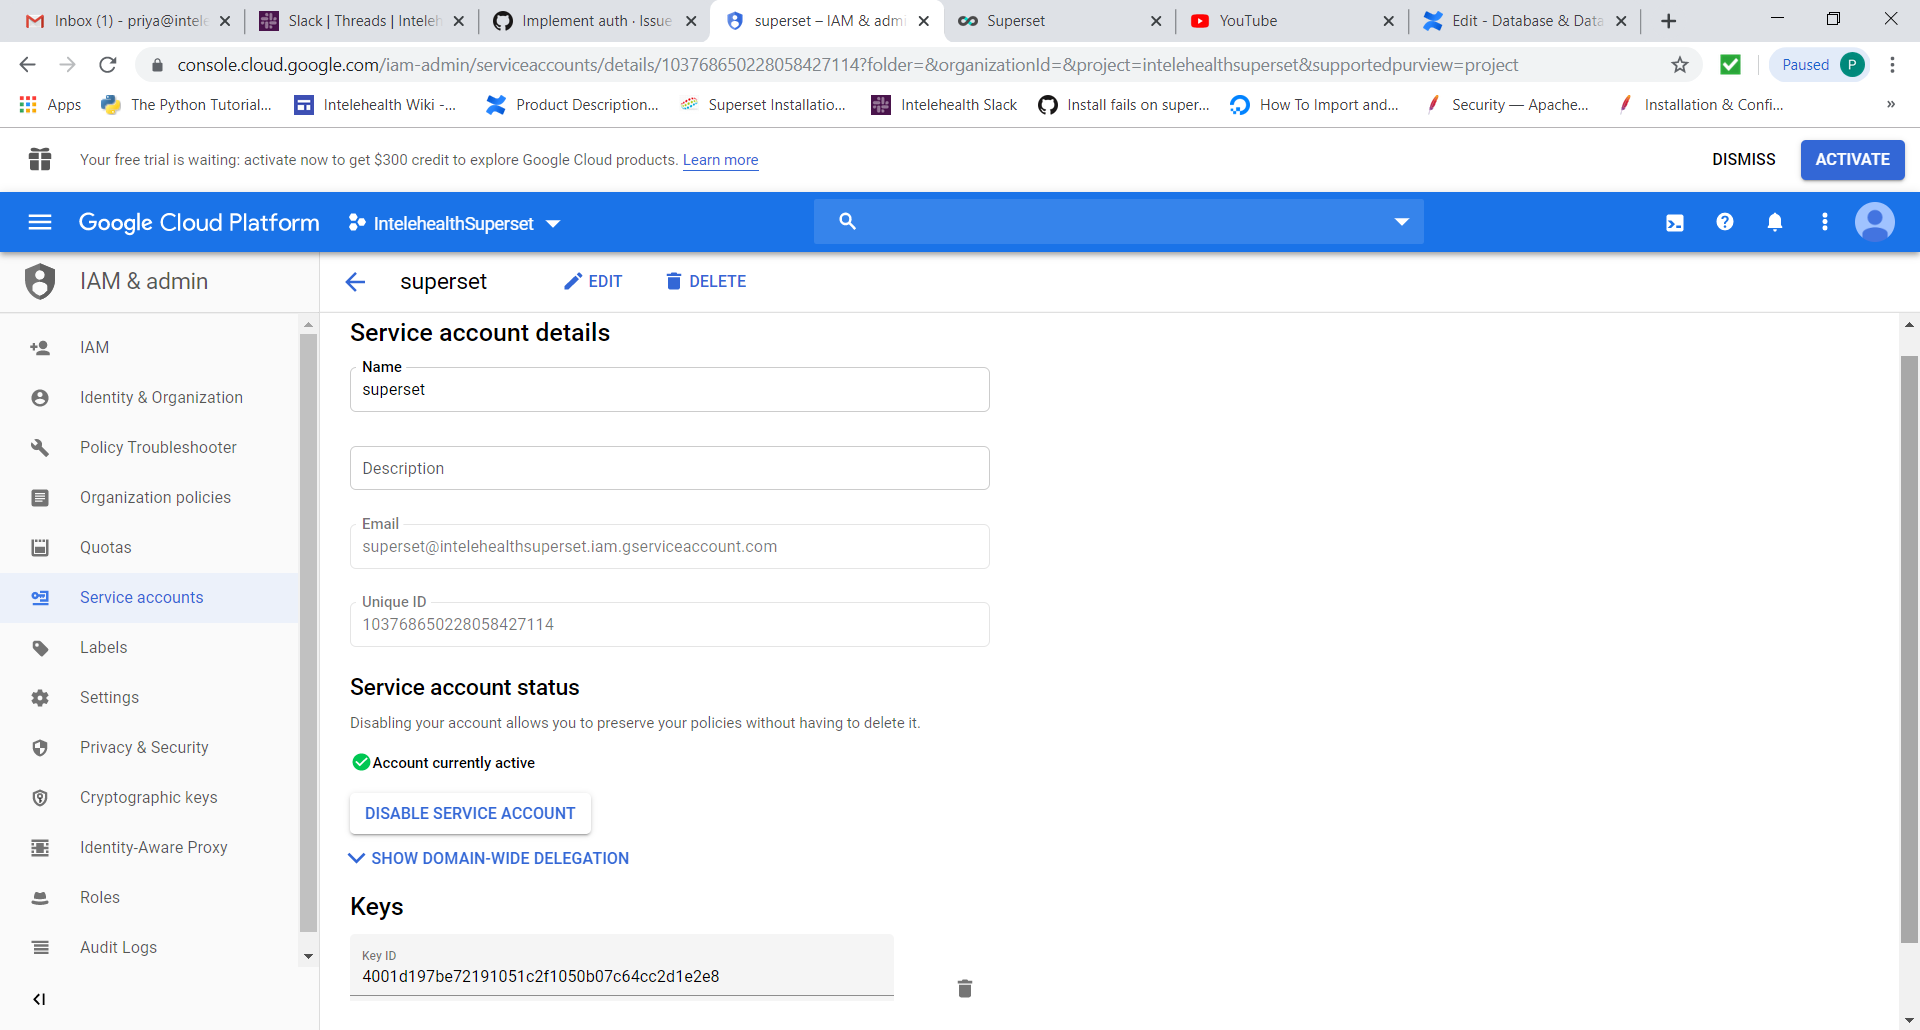
Login to Google Console Admin using your intelehealth email id (https://console.cloud.google.com/iam-admin/serviceaccounts)
Ensure you select “Enable G-suite domain wide delegation” checkbox
Download the key created by google for your service account as json file
Manage API client access at https://admin.google.com/${DOMAIN}/AdminHome?chromeless=1#OGX:ManageOauthClients
Add the "Unique ID" from step 1 as the "Client Name"
Add the scope as “
https://www.googleapis.com/auth/spreadsheets.readonly”
Connect to superset server 13.233.116.180 (user: ubuntu)
Run following commands in the sequence mentioned below:
cd superset/my_viz
. bin/activate
pip install gsheetsdbpip install gsheetsdb[cli]pip install gsheetsdb[sqlalchemy]
Go to path /home/ubuntu/superset/my_viz/lib/python3.6/site-packages/gsheetsdb
Access file auth.py under this folder
Add the following lines at the start of function “get_credentials_from_auth”:
if not subject:
subject='priya@intelehealth.io'if not service_account_file:
service_account_file='/home/ubuntu/superset/my_viz/intelehealthsuperset-4001d197be72.json/intelehealthsuperset-4001d197be72.json'
stop the superset python process running on the server & restart the same
Connect to Superset application in browser as admin using https://dashboards.intelehealth.io
Go to menu Sources → Databases
Add a new database with below details:
Database Name: Google_Sheets
SQLAlchemy URI : gsheets://
Click the button “Test Connections”
Once the connection is established successfully, save the new database by hitting the save button
Now you can create a table based on google sheets as follows:
Access the menu Sources → Tables
Create a new table where database is “Google_Sheets” and Table Name is the shareable link of the concerned google sheet.